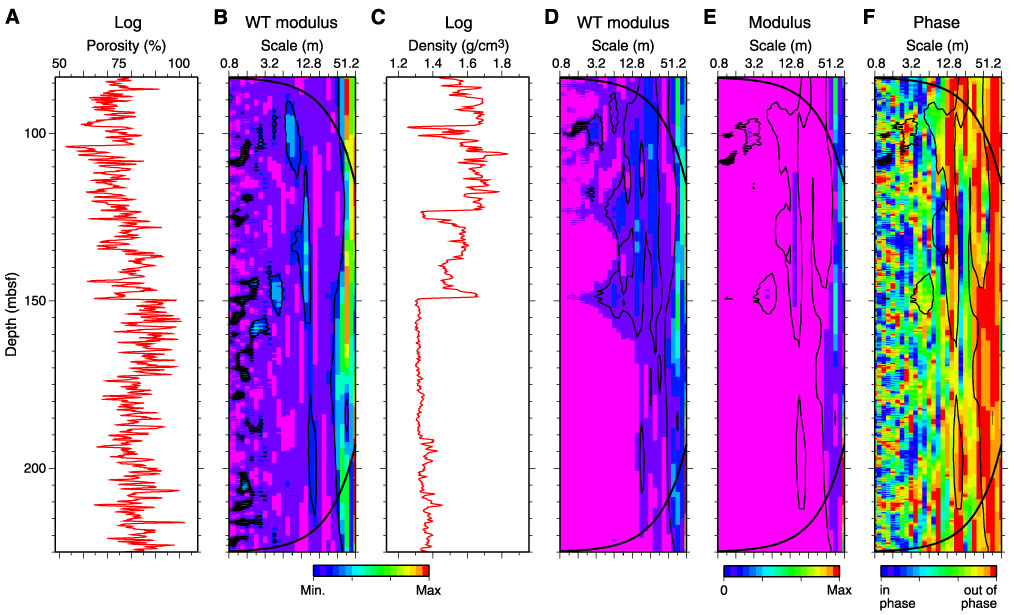
Figure F47. Wavelet transform (WT) analyses of (A) porosity and (C) density logs from pass 1 of the triple combo. The wavelet spectrum diagrams for (B) porosity and (D) density show a dominant depth-scale frequency at ~15 m, with a less significant higher frequency at ~4 m. The same pattern is shown in the (E) cross-wavelet modulus, and the two data sets are (F) out of phase as expected. NB Pass 1 shows the same pattern. NB = nota bene, or note.