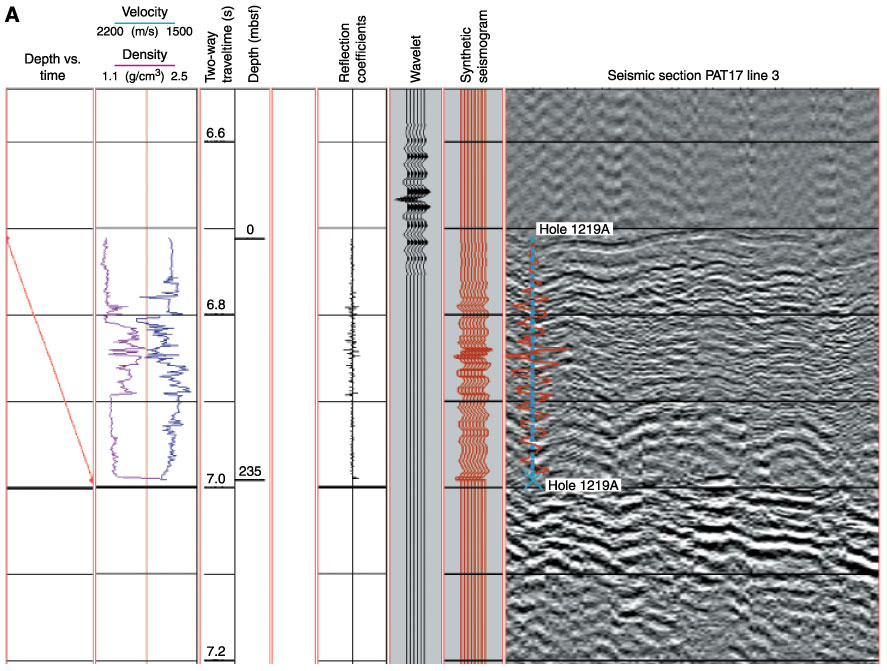
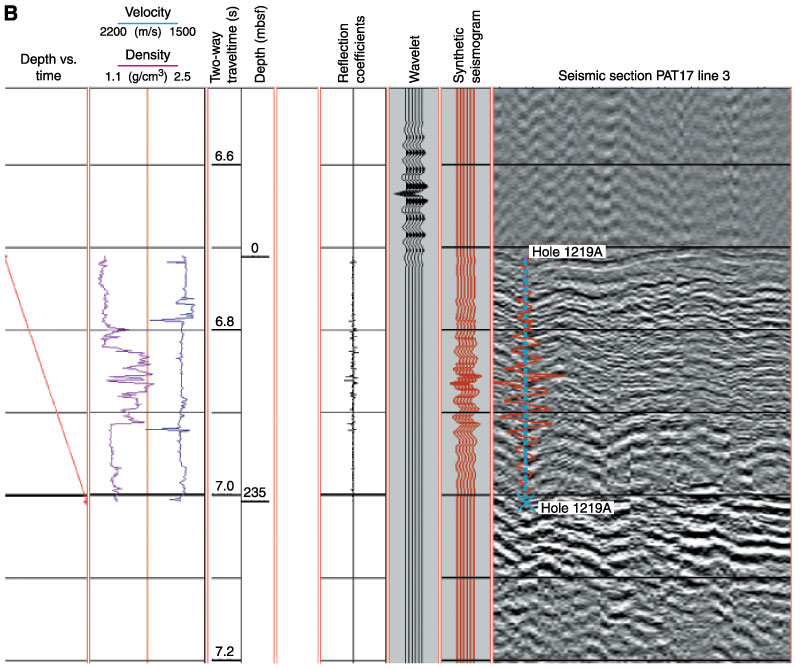
Figure F48. A. Synthetic seismogram derived from velocity (split core) and density (spliced log and corrected GRA core) data for Hole 1219A. Note the depth vs. time difference between the bottom of the hole and the first strong (chert?) reflector below. Depth vs. time relationship, density, velocity, and reflection coefficient curves are also shown. B. Synthetic seismogram derived from velocity (whole core) and density (spliced log and corrected GRA core) data for Hole 1219A. Note the location of the bottom of the hole on top of the first strong (chert?) reflector. Depth vs. time relationship, density, velocity, and reflection coefficient curves are also shown.