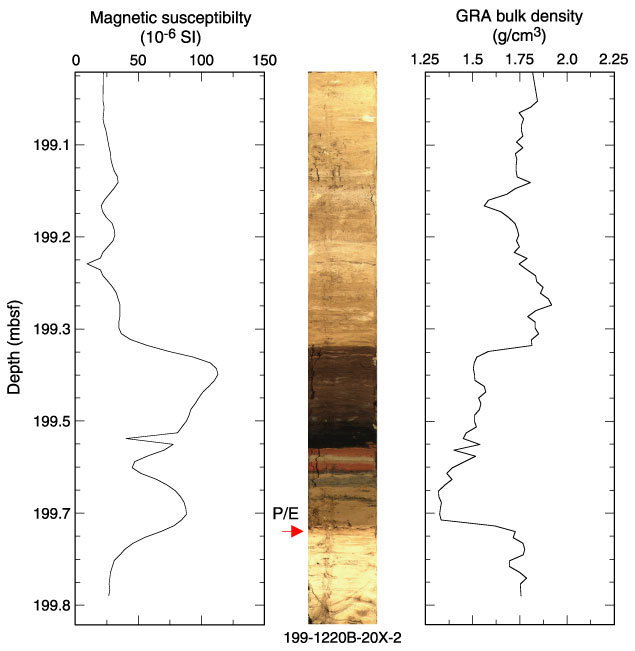
Figure F24.
Comparison of magnetic susceptibility and gamma ray attenuation (GRA) bulk density with the digital core image from Section 199-1220B-20X-2. The red arrow denotes the Paleocene/Eocene (P/E) boundary.