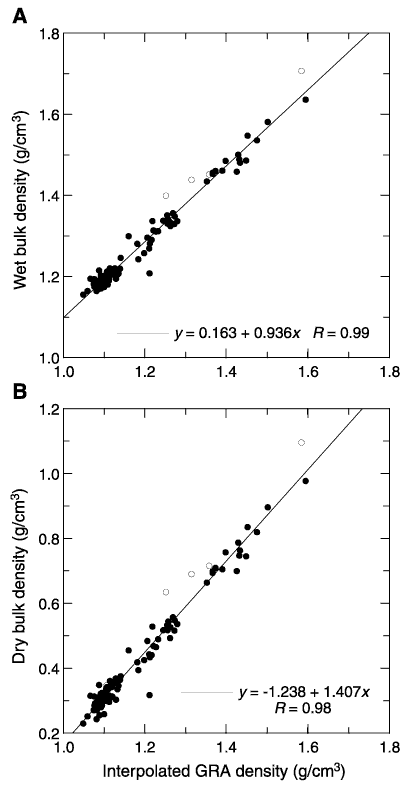
Figure F25. (A) Wet and (B) dry bulk density from discrete samples from Hole 1220A and Cores 199-1220B-9H through 20X plotted with gamma ray attenuation (GRA) bulk density interpolated with a 20-cm-wide Gaussian window. Samples from APC cores are indicated by solid symbols; XCB cores are represented by open symbols.


![]()