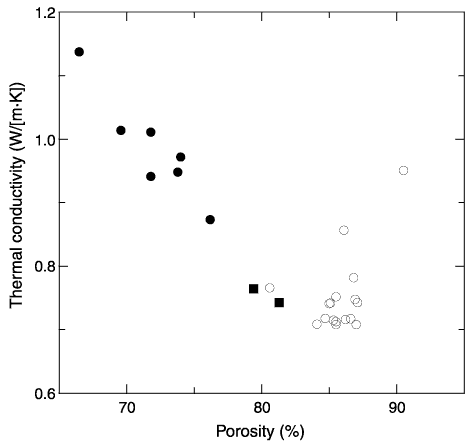
Figure F30. Thermal conductivity plotted with porosity for Holes 1220A and 1220B. An inverse relationship between thermal conductivity and porosity characterizes the clay (solid circles) and nannofossil ooze (squares) but is lacking in the radiolarian ooze and clay (open circles). Porosity values for Cores 199-1220B-2H through 8H were derived from the gamma ray attenuation (GRA) bulk density using the regression of porosity with GRA bulk density for sediments in Hole 1220A and Cores 199-1220B-9H through 20X. Porosity = 136.8 - GRA density x 46.0. R = 0.96.


![]()