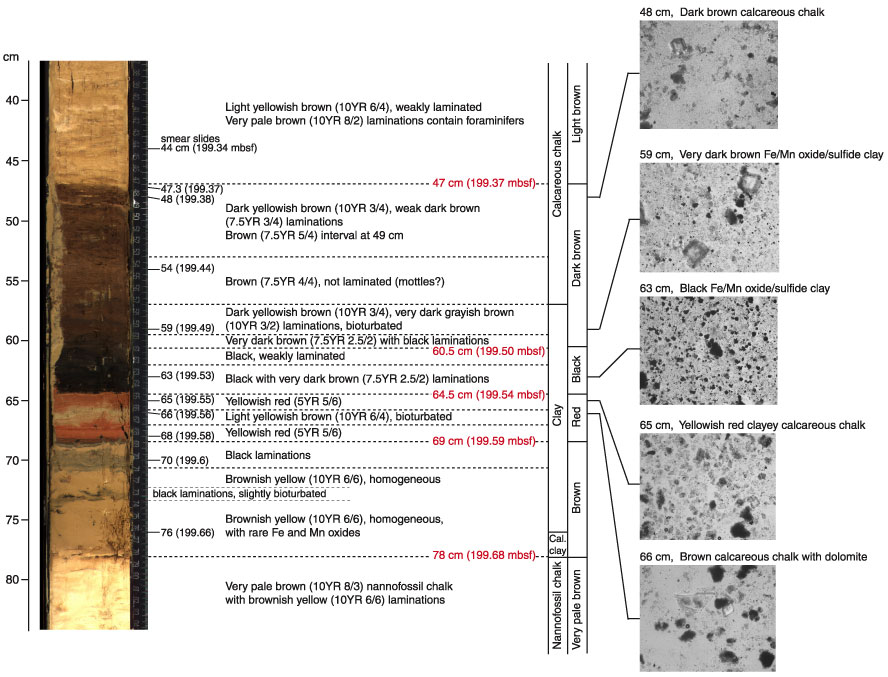
Figure F4. Close-up composite digital photograph of interval 199-1220B-20X-2, 40-80 cm, showing the P/E boundary sequence. Photomicrographs of sediment at selected intervals shown on right. Lithologic and color variations are also noted. Cal. = calcareous.