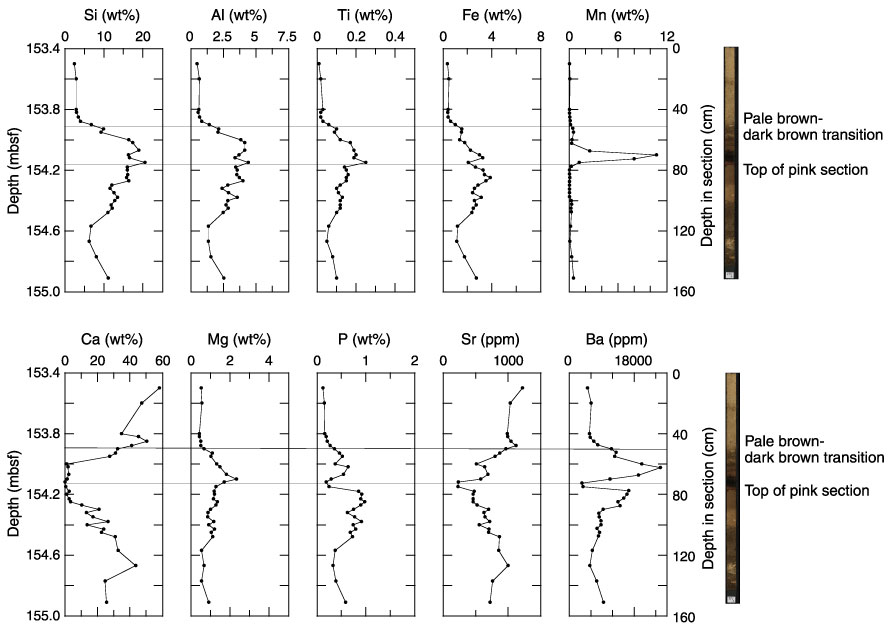
Figure F16. Bulk-sediment geochemical data for the P/E boundary from Site 1221. Horizontal lines = stratigraphic interval with most prominent color variation in lithology. Calcium values higher than 35.9 wt% are out of the range of the standards (see "Geochemistry" in the "Explanatory Notes" chapter).