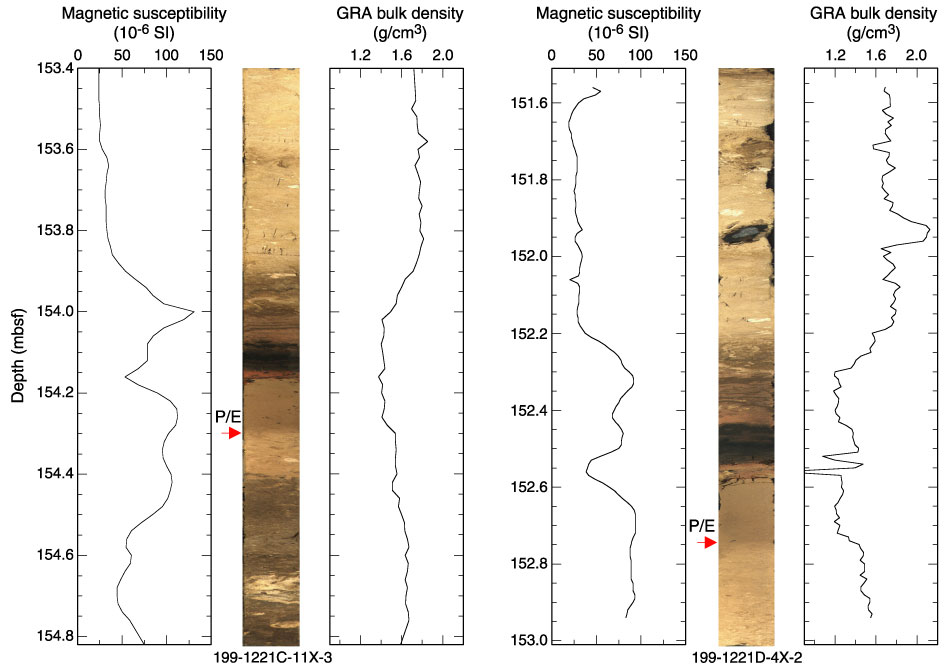
Figure F18.
Comparison of magnetic susceptibility and gamma ray attenuation (GRA) bulk density with the digital core images from Sections199-1221C-11X-3 and 199-1221D-4X-2. The red arrows denote the P/E boundary.