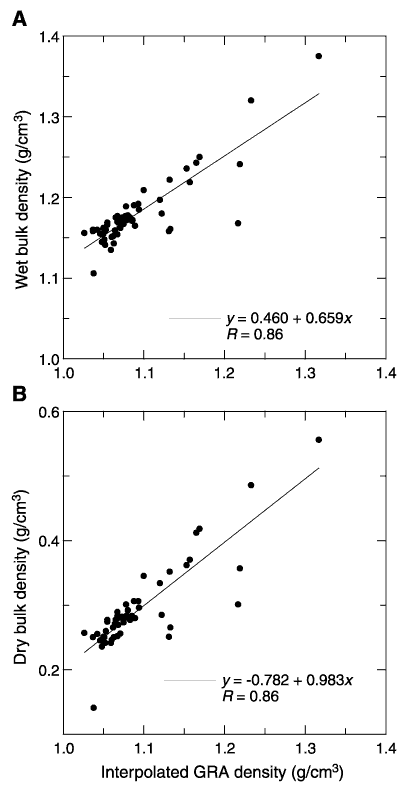
Figure F19. (A) Wet and (B) dry bulk density from discrete samples from Cores 199-1221A-1H through 3H, 6H through 11H, and 199-1221B-1H plotted with gamma ray attenuation (GRA) bulk density interpolated with a 20-cm-wide Gaussian window. GRA bulk densities from Cores 199-1221A-4H and 5H, which appear to be offset by an electronic artifact in MST data acquisition, are not included in the comparison.


![]()