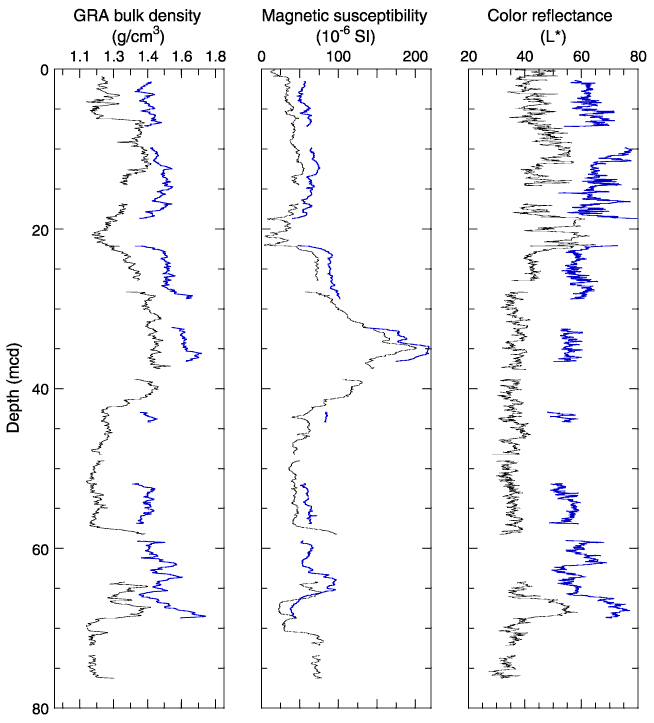
Figure F8. Gamma ray attenuation (GRA) bulk density, magnetic susceptibility, and color reflectance (L*) data for Holes 1222A (black; left curve in each panel) and 1222B (blue; right curve in each panel) plotted vs. composite depth. The data from Holes 1222B are offset by constants for illustration purposes. All data sets are smoothed with a nine-point Gaussian filter. Intervals with obvious flow-in or drilling disturbance are removed from the data sets (see Table T4).