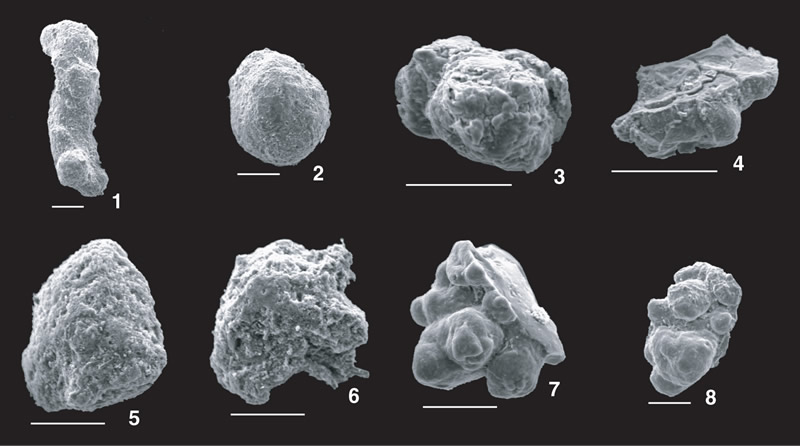
Figure F5.
SEM images of representative ferromanganese micronodules (scale bar = 100 µm).
1–4.
Sample 199-1216A-1H-4, 60–62 cm (5.1 mbsf).
5–8.
Sample 199-1216A-2H-6, 45–47 cm (17.15 mbsf).