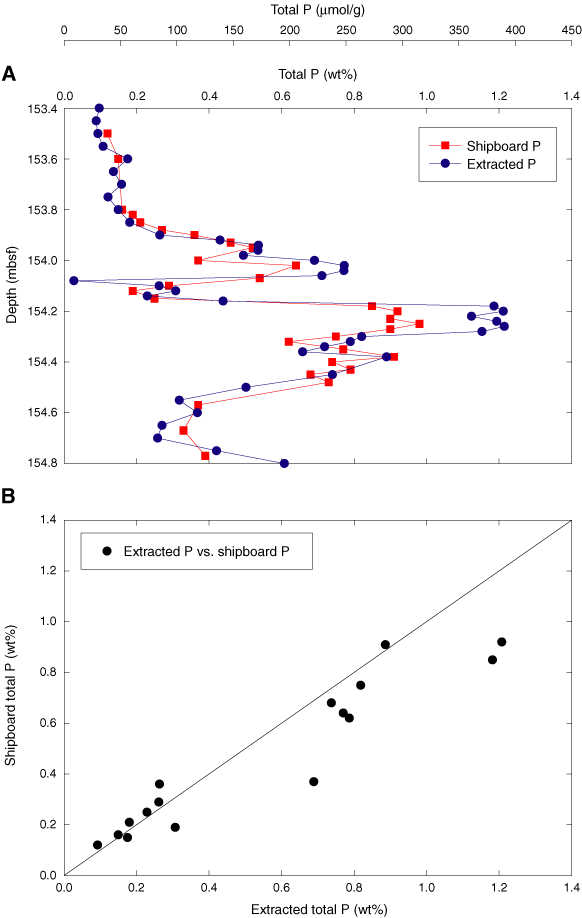
Figure F1. A. Total P from the four-step extraction process (Table T1) and shipboard P (Table T3) (Lyle, Wilson, Janecek, et al., 2002) vs. depth. B. Total P from the four-step extraction vs. shipboard P. Only the samples for which depth horizons exactly correspond are plotted. For linear regression, slope = 0.74 ± 0.06 and y-intercept = 0.07 ± 0.04; r2 = 0.90. A 1:1 line is plotted for reference.