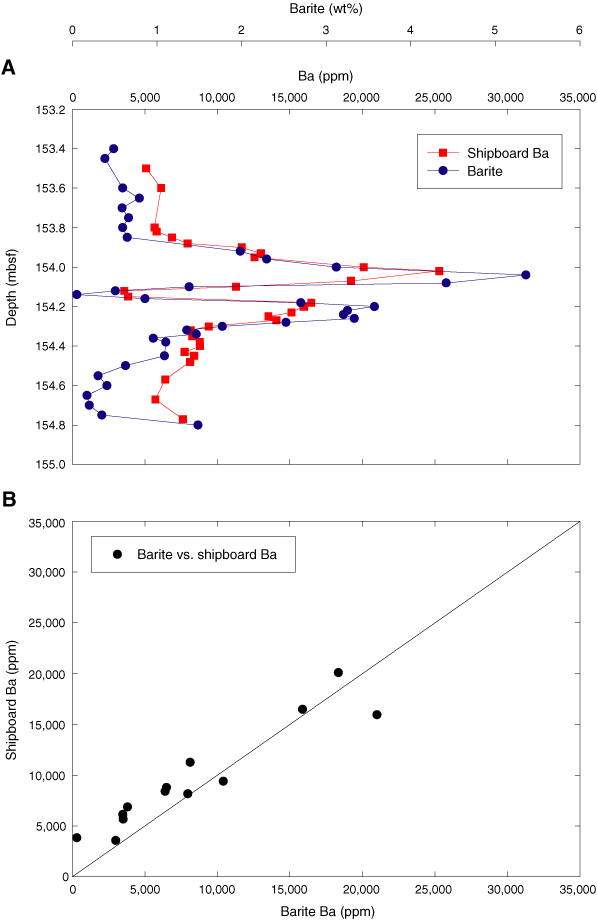
Figure F2. A. Barite (Table T1) and shipboard Ba (Table T3) (Lyle, Wilson, Janecek, et al., 2002) vs. depth. B. Barite vs. shipboard Ba. Only the samples to which depth horizons exactly correspond are plotted. For linear regression, slope = 0.75 ± 0.08 and y-intercept = 3300 ± 800; r2 = 0.89.


![]()