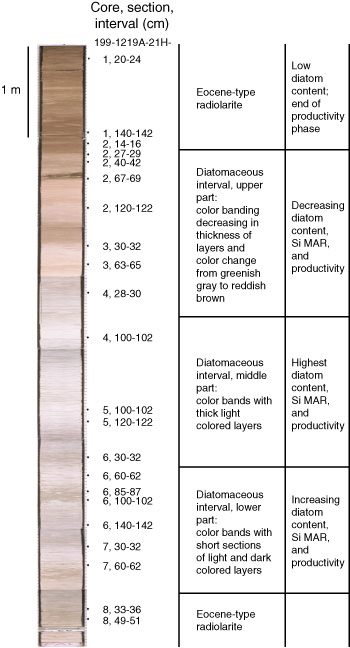
Figure F4. Lithologic sequence of the Zone RP-15 diatom-rich interval. Composite core images clearly show color changes and banding representing three diatom-rich intervals and their interpretation with respect to productivity and Si mass accumulation rates (Shipboard Scientific Party, 2002). MAR = mass accumulation rate.