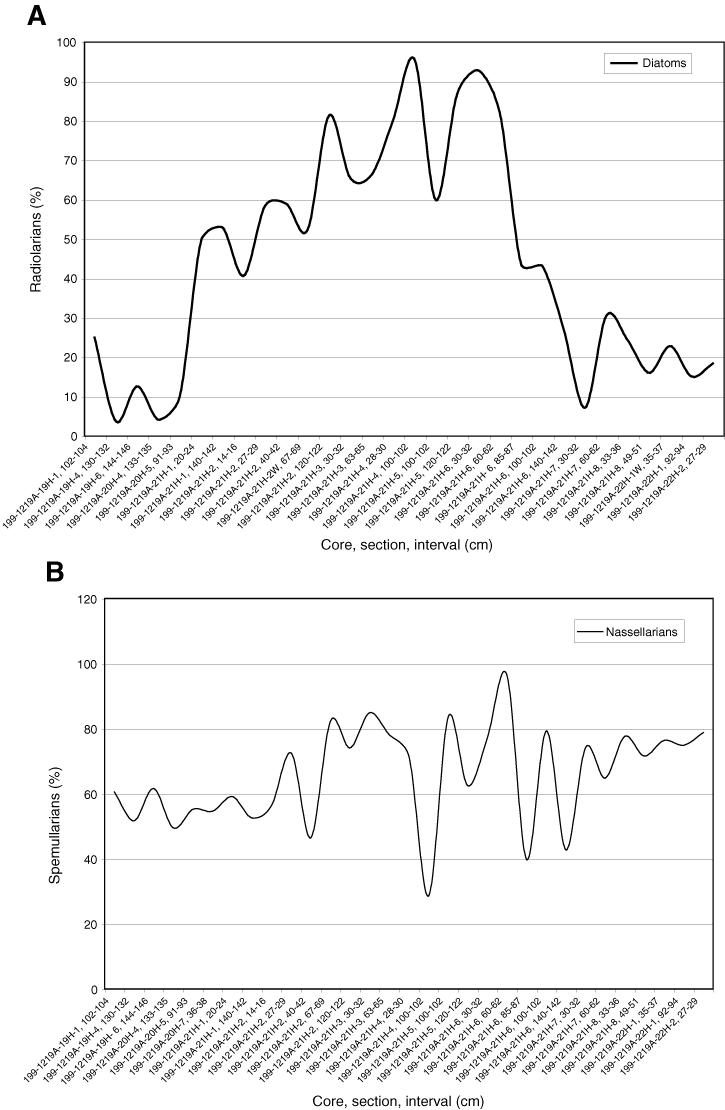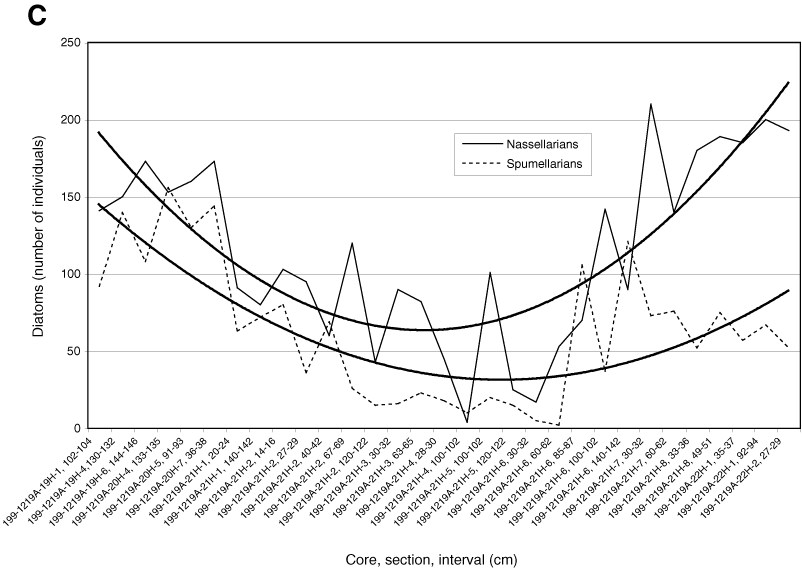
Figure F5. Ratios of siliceous organisms between Cores 199-1219A-22H and 19H. A. Diatom:radiolarian ratio shows the general trends of diatom development and stepwise reduction in Core 199-1219A-21H. B. Impression of radiolarian fluctuations during the diatom interval, mostly reflecting the high occurrences of artostrobids in the samples. C. General shift of the nassellarian:spumellarian distribution compared to diatom quantities. Because of the increase of actinommids, the nassellarian:spumellarian ratio equals during the final phase of the diatom interval.


![]()