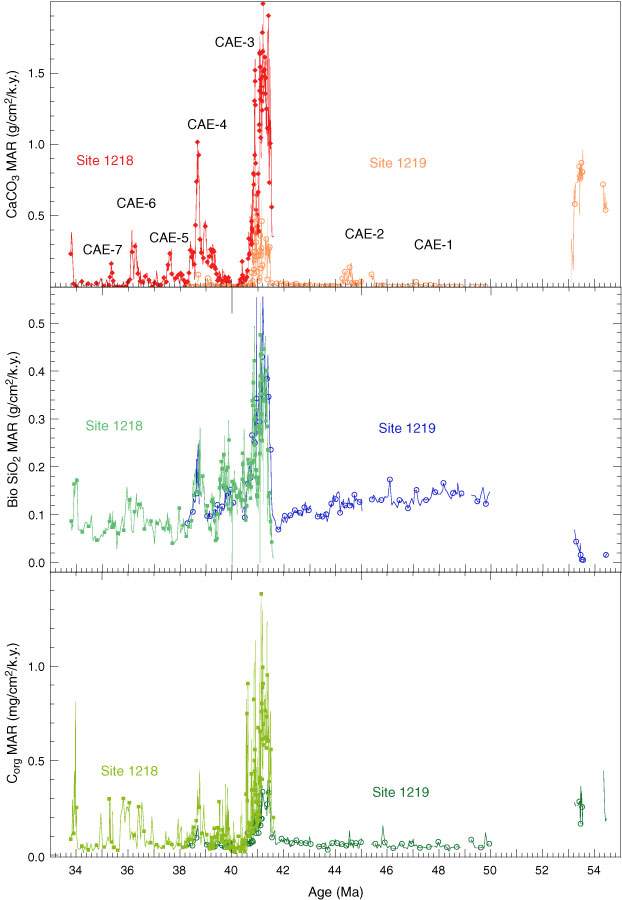
Figure F3.
Time series for CaCO
3
mass accumulation rate (MAR), biogenic SiO
2
MAR, and C
org
MAR. MAR time series better show that the carbonate accumulation events (CAEs) between 41.5 and 38.2 Ma are much larger than the other Eocene events.