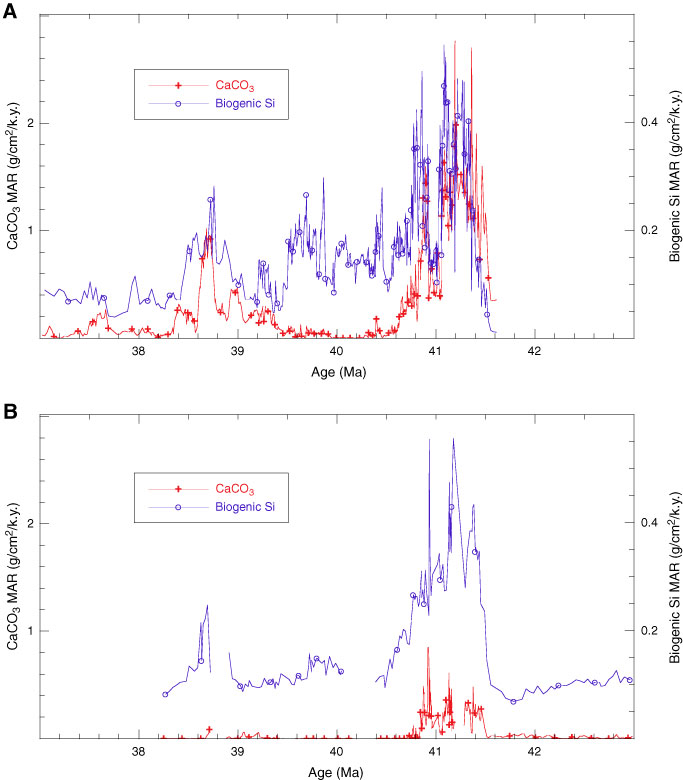
Figure F4. Detail of interval from 43 to 37 Ma from (A) Site 1218 and (B) Site 1219 to show that CaCO3 mass accumulation rate (MAR) disappears while biogenic SiO2 MAR remains relatively high. The exaggerated decrease in CaCO3 MAR indicates much stronger dissolution in the interval between 40.7 and 39.6 Ma.