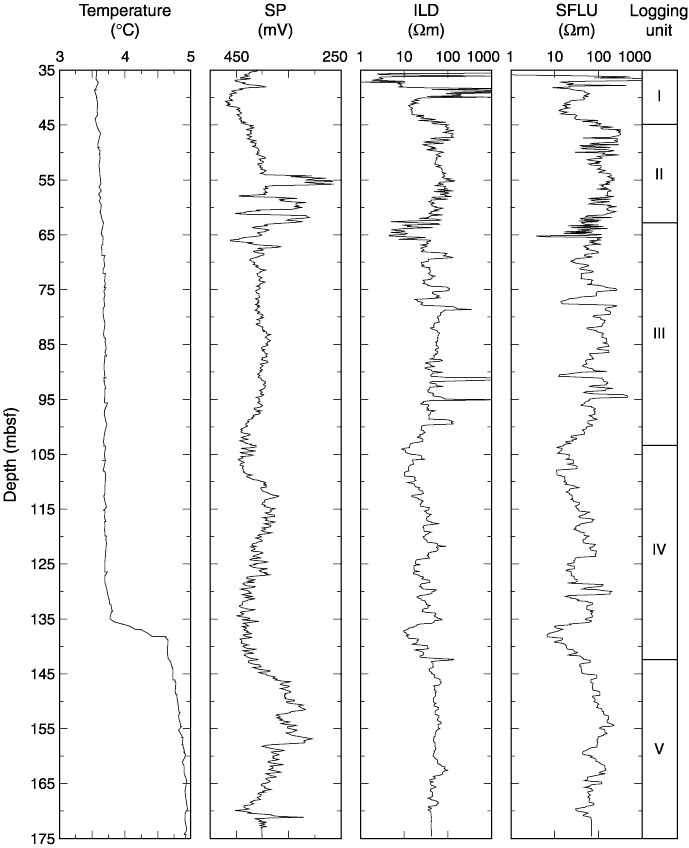
Figure F21. Composite log of the temperature, spontaneous potential (SP), and electrical resistivity logs recorded in Hole 1224F during Leg 200. Track 1: temperature. Track 2: SP. Track 3: deep induction resistivity (ILD). Track 4: spherically focused resistivity log
(SFLU).