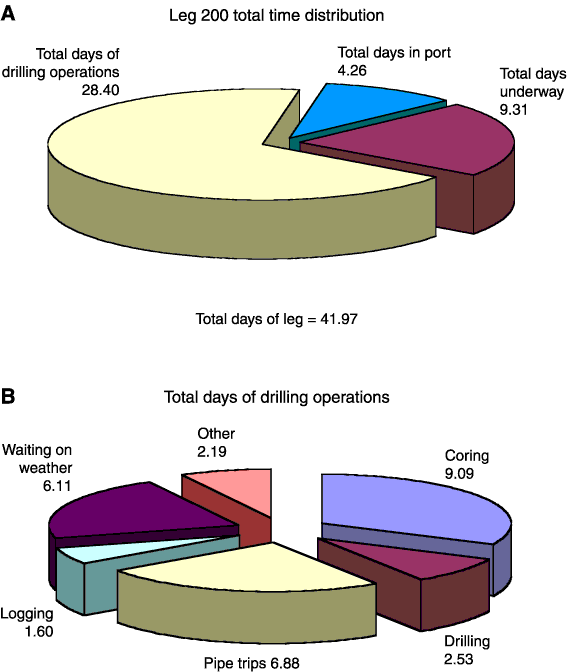
Figure F7.
Leg 200 time distribution charts. Comparisons of (
A
) onsite, underway, and in-port days and (
B
) site activities.