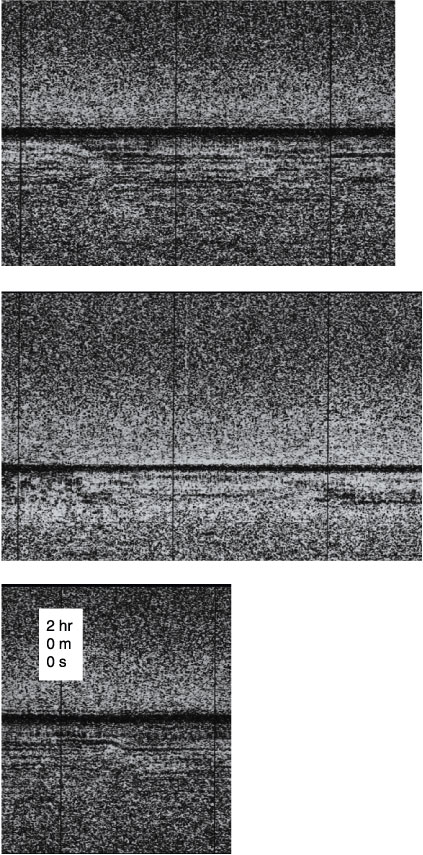
Figure F82. Three examples of 3.5-kHz echo soundings showing changes in the reflection sequence. Vertical traveltime interval from top to bottom is 212 ms. The vertical lines are 5-min recording marks. There are 30 traces per minute. The dark horizontal line is the seafloor reflection. Note the discontinuous nature of several of the subseafloor reflectors and, for some, an apparent change in
traveltime.