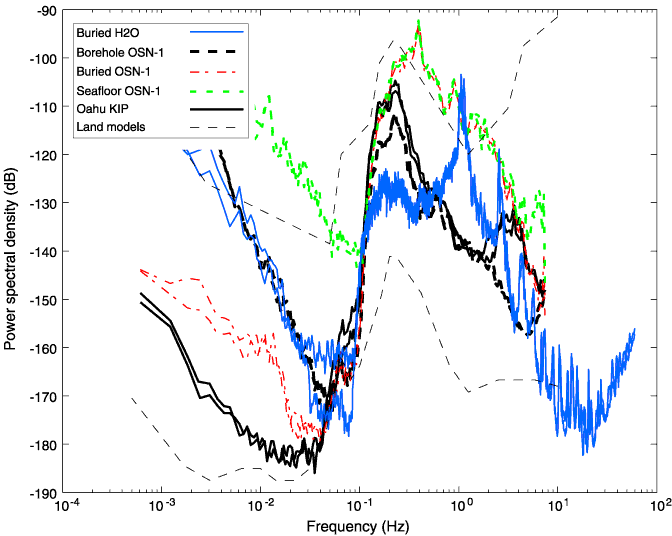
Figure F25. Horizontal component spectra from the seafloor, buried, and borehole installations at the Ocean Seismic Network site (OSN-1) are compared to the spectra from the buried installation at the Hawaii-2 Observatory (H2O) and from the Kipapa, Hawaii (KIP), Global Seismic Network station on Oahu. The sediment resonance peaks in the band 0.3 to 8 Hz are up to 35 dB louder than background levels and far exceed the microseism peak at 0.1 to 0.3 Hz. That the resonance peaks are considerably higher for horizontal components than for vertical components is consistent with the notion that these are related to shear wave resonances (or Scholte modes). Power spectral density is given in decibels (dB) relative to 1 (m/s2)2/Hz.