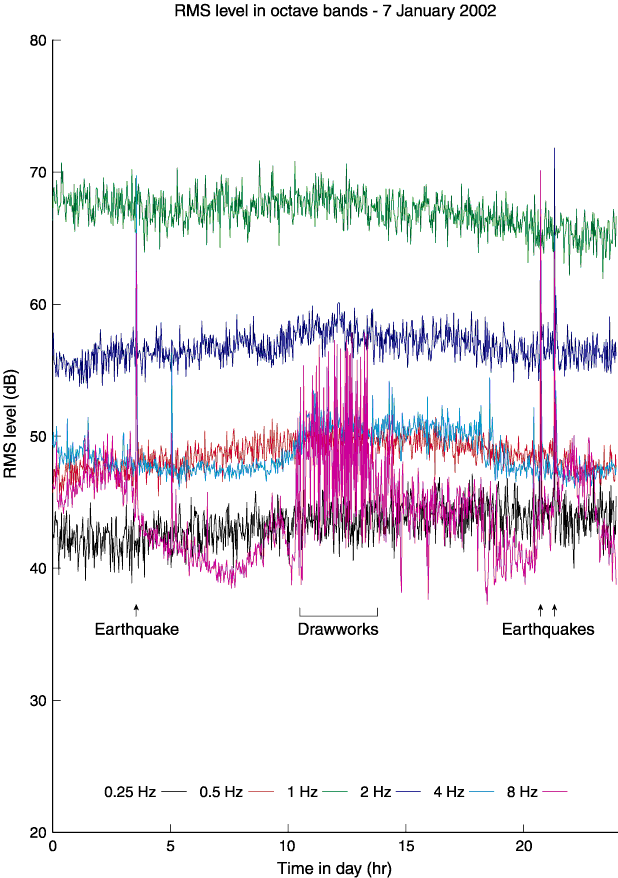
Figure F93. Tracking root-mean-square (RMS) levels in one-octave bands is a convenient way to observe time-dependent effects in the data. The spikes around 5 and 20 hr in this figure correspond to earthquake events. The intense activity between 10 and 15 hr can be associated with the drawworks. RMS levels are given in decibels relative to a count.