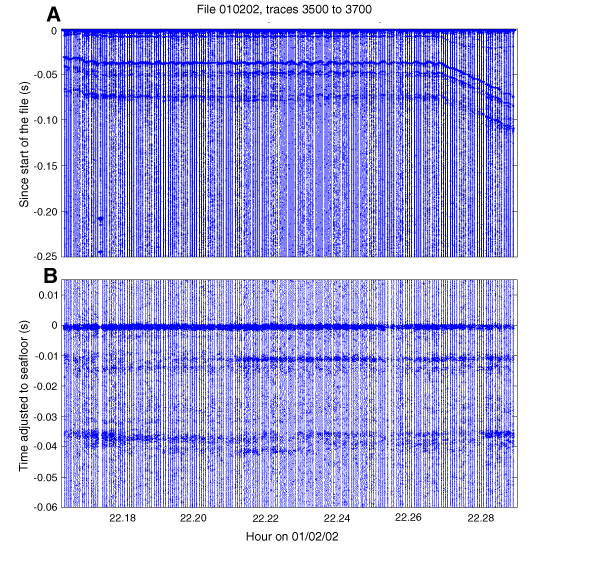
Figure F6. A. 0.25-s data window with time 0 starting at the direct water wave arrival. The data at ~0.035 s is the seafloor arrival. Note the roughness due to ship's heave. B. Data lined up at the first motion of the waveform representing the seafloor. Only 0.060 s of data are shown below the seafloor. Note how the subbottom reflectors line up coherently.


![]()