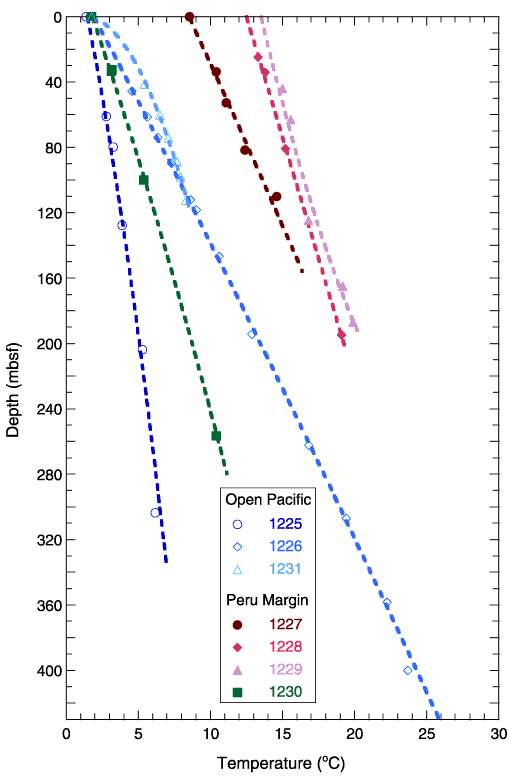
Figure F3. Downhole temperature profiles of Leg 201 sites. Symbols = measured downhole and seafloor temperatures. Dashed lines = least-square fits illustrating differences in gradients and offset of shelf sites resulting from higher seafloor temperatures.


![]()