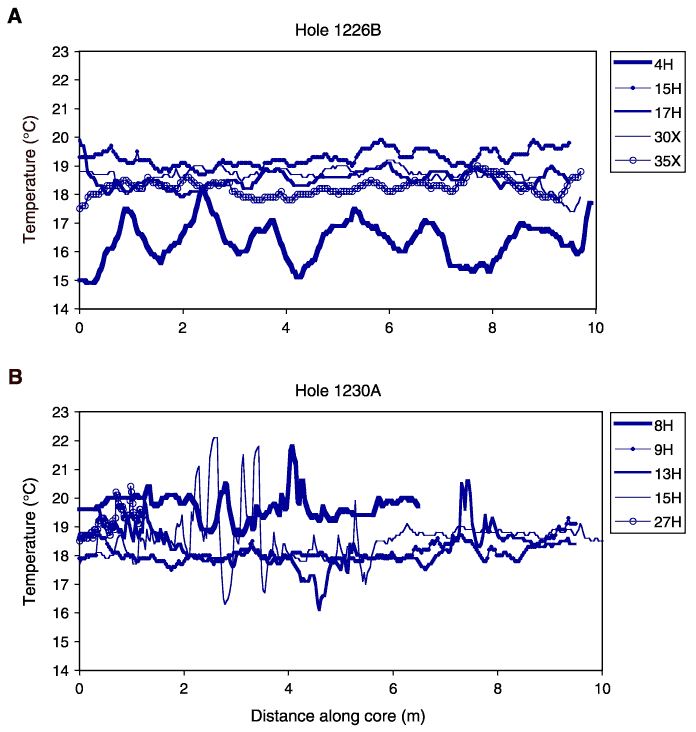
Figure F4. Trends in core liner temperatures for five randomly selected cores from (A) Site 1226 and (B) Site 1230. R2 values for Site 1226 range from 0.002 to 0.3. R2 values for Site 1230 range from 0.01 to 0.5. No consistent downcore trend is seen. Scan method and time do not have an effect on measured core liner temperatures.


![]()