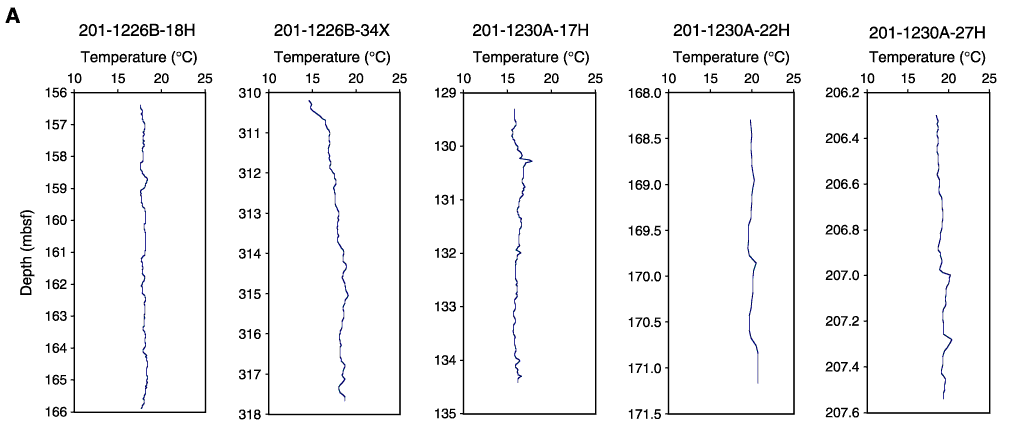
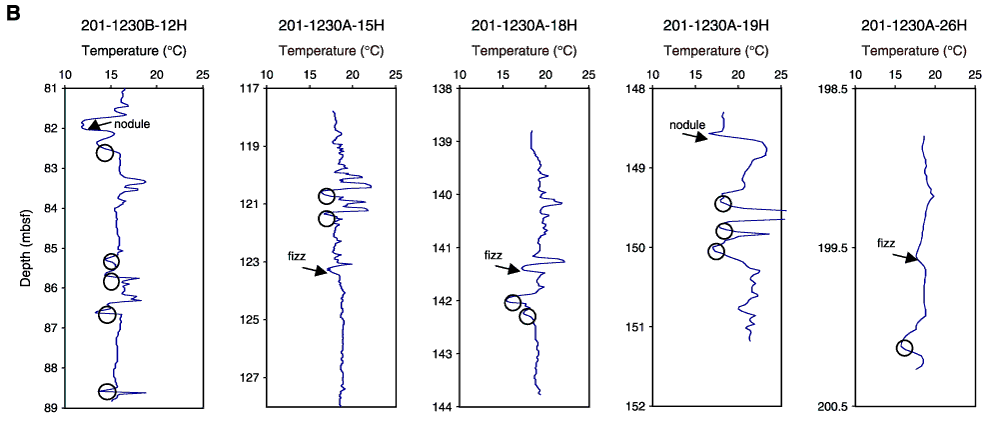
Figure F6. Comparison of downcore plots of temperatures of cores without hydrate and with hydrate. A. Cores without hydrate. Visually confirmed hydrate nodule or fizzing sediment occurrences are identified with arrows and description of observation. Possible hydrate occurrences are circled. B. Cores with hydrate.