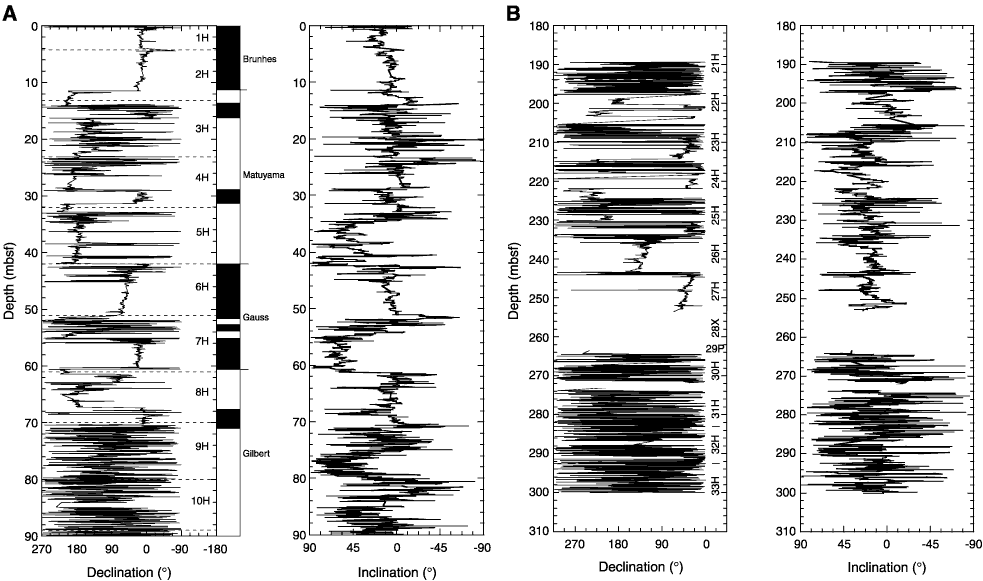
Figure F18. A. Declination and inclination profiles for the uppermost 90 m of Hole 1225A, demagnetized at 15 mT, with identification of polarity chronozones. B. Declination and inclination profiles for the lowermost 110 m of Hole 1225A, demagnetized at 15
mT.


![]()