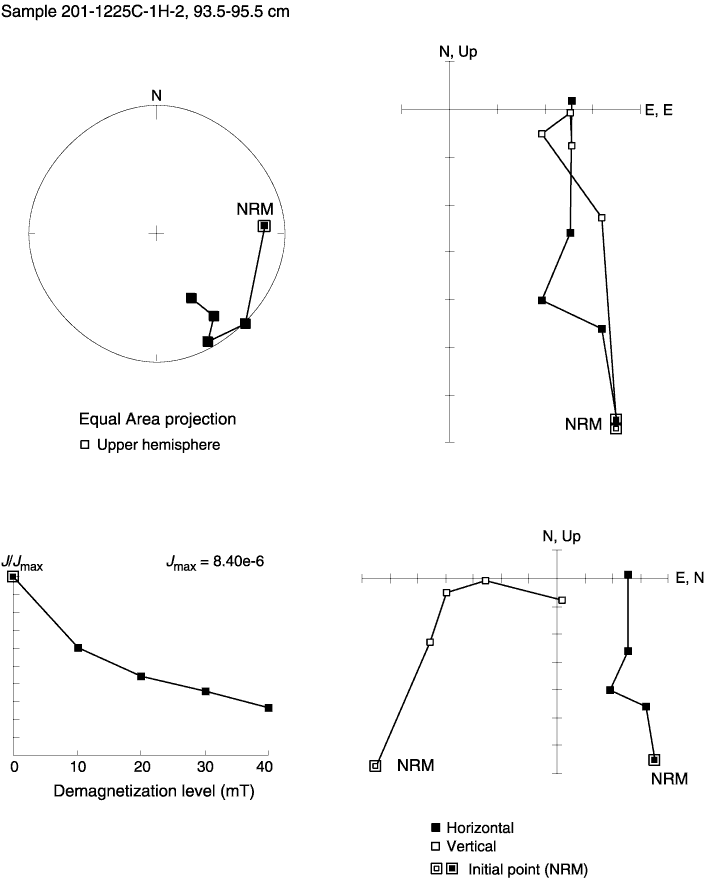
Figure F20. Principal component analysis of natural remanent magnetization (NRM) of Sample 201-1225C-1H-2, 93.5-95.5 cm, including equal-area projection of directions of magnetization during demagnetization, intensity of magnetization plotted vs. demagnetization, and vector component diagrams showing projection of magnetic vector's endpoints on horizontal and vertical planes.


![]()