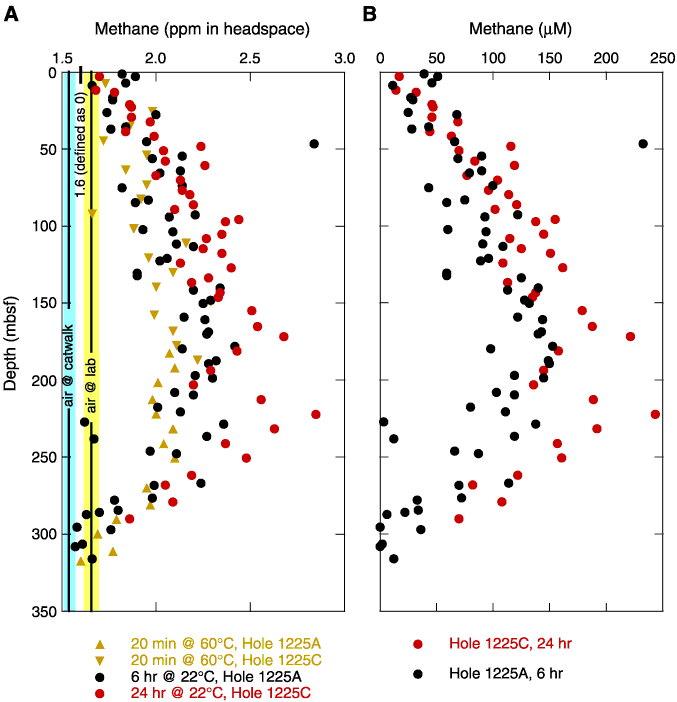
Figure F6. A. Methane concentration in Holes 1225A and 1225C obtained under different headspace incubation techniques. Only samples with a sediment volume of 3 mL are illustrated. The two vertical lines designate the mean values of replicate analyses of methane concentrations in ambient air on the catwalk (n = 5) and in the chemistry laboratory (n = 4); the shaded bars indicate the standard deviation of the respective measurements. For subsequent determination of concentrations of methane in interstitial waters, the value of 1.6 ppm was subtracted from the measured value. B. Methane concentrations in interstitial waters of Holes 1225A and 1225C. Porosity data are derived from GRA data (see "Density and Porosity" in "Physical Properties"). Note that the systematically higher concentrations in Hole 1225C reflect the longer incubation time rather than differences in concentrations of the two adjacent holes.


![]()