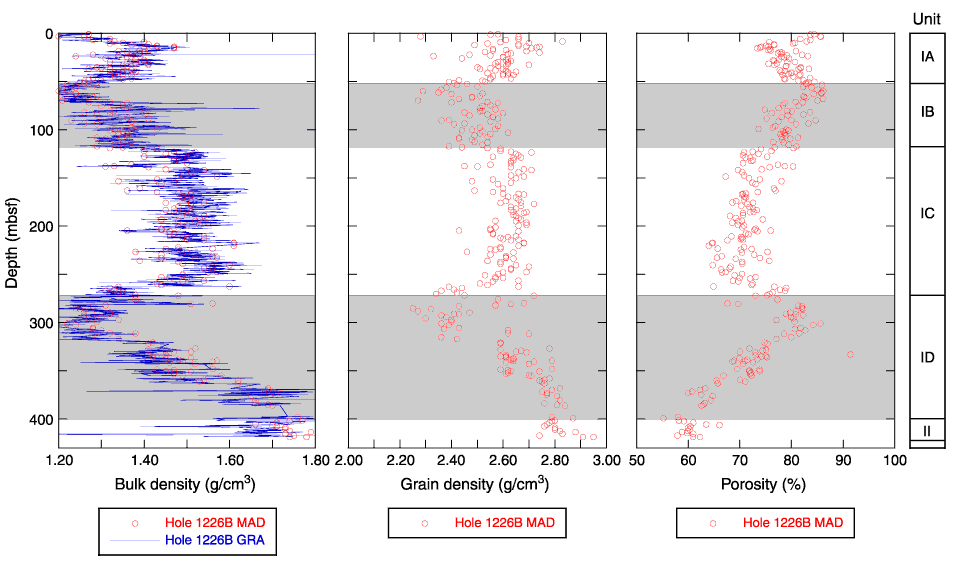
Figure F23. Mass/volume moisture and density measurements (MAD) for Hole 1226B. A. Gamma ray attenuation (GRA) and MAD bulk density profiles. B. Hole 1226B grain density profile. Note the diatom-enriched intervals at the tops of Subunits IB and ID, respectively. C. Porosity profile showing substantial porosity increase at the tops of Subunits IB and ID, respectively, probably due to increased intrafrustule pore volume.


![]()