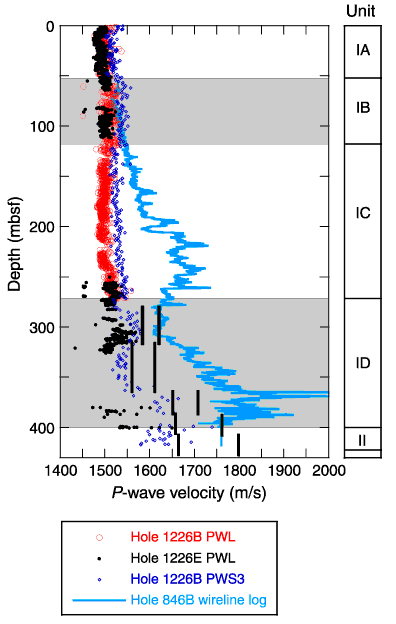
Figure F24. P-wave velocity profiles derived from P-wave logger (PWL) and PWS3 measurements for Site 1226 and Hole 846B sonic logs. Thick black lines over five distinct depth intervals represent minimum and maximum velocities measured shipboard. Additional discussion of the downhole variation in PWS3 and logging measurements and of the analysis to determine the minimum-maximum shipboard velocity constraints is provided in in "Compressional Wave Velocity" in "Physical Properties."


![]()