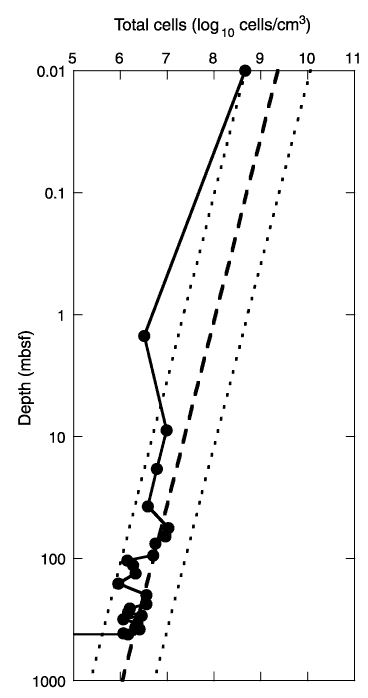
Figure F8. Profile of total prokaryotic cells in Holes 1226E (upper two data points) and 1226B (rest of data points). The heavy dashed line is a model regression line derived from previous ODP legs and updated from Parkes et al., 1994 (log10 cells = 8.03 - 0.66 log10 depth), lighter dashed lines represent the ±2- envelope cell concentrations at previously censused ODP sites.