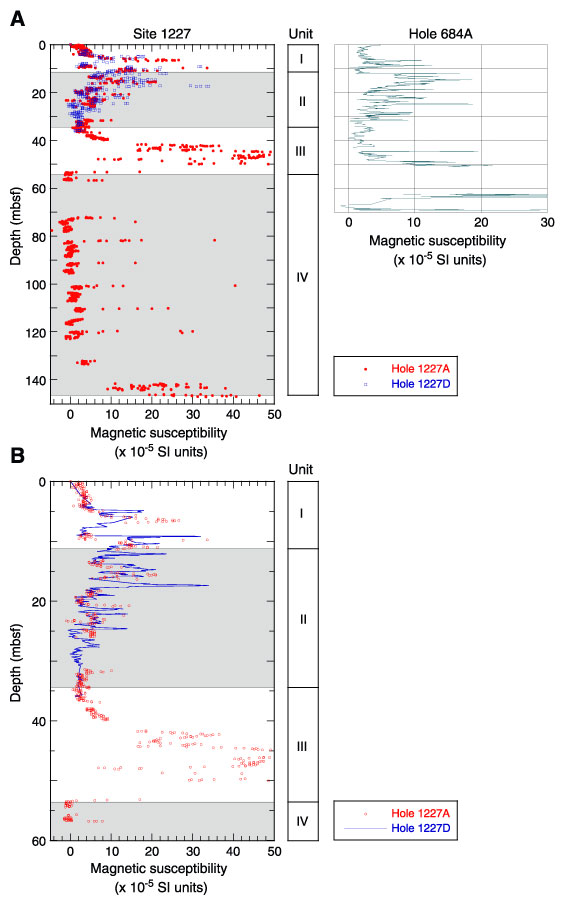
Figure F12. A. Comparison of magnetic susceptibility data from Leg 112 postcruise study of Site 684 (Merrill et al., 1990) with the multisensor track data from Holes 1227A and 1227D. B. Section from 0 to 60 mbsf showing the details and correlation of the individual susceptibility bands between Holes 1227A and 1227D.