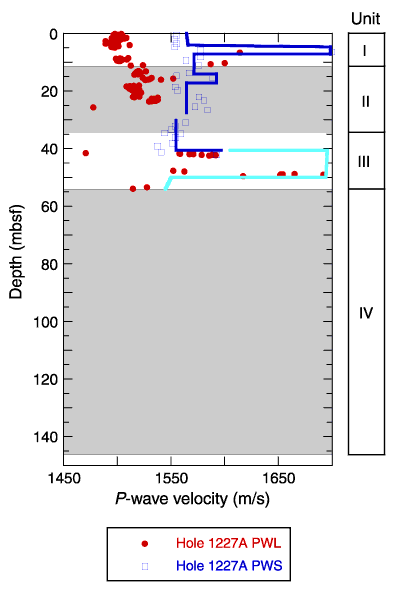
Figure F18. P-wave velocity profiles derived from P-wave logger (PWL) and PWS3 measurements for Site 1227. Thick dark blue lines provide an interpretation of the PWS3 measurements consistent with lithostratigraphic changes. The thin aqua-blue line projects PWS3 velocities from the changes in PWL measurements. Relative to the ooze sediments making up the dominant lithology of the upper 55 mbsf, the two coarse-grained silts beginning at ~6.2 and 42.0 mbsf are clearly defined by a 150-m/s increase in P-wave velocity.


![]()