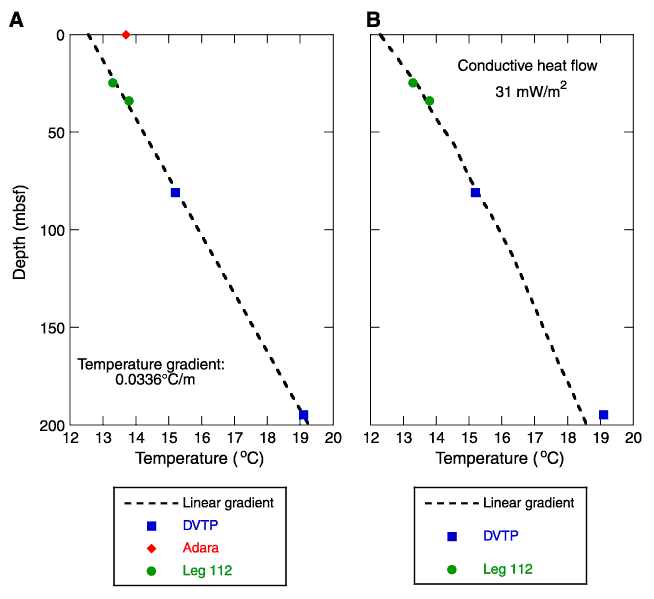
Figure F21. A. All temperatures measured in Hole 1228A together with the temperature data from Leg 112 Site 680 plotted vs. depth with a best-fit linear profile for the combined data. B. Temperature data with steady-state conductive temperature profile calculated using measured thermal conductivities from Hole 1228A and uniform heat flow.


![]()