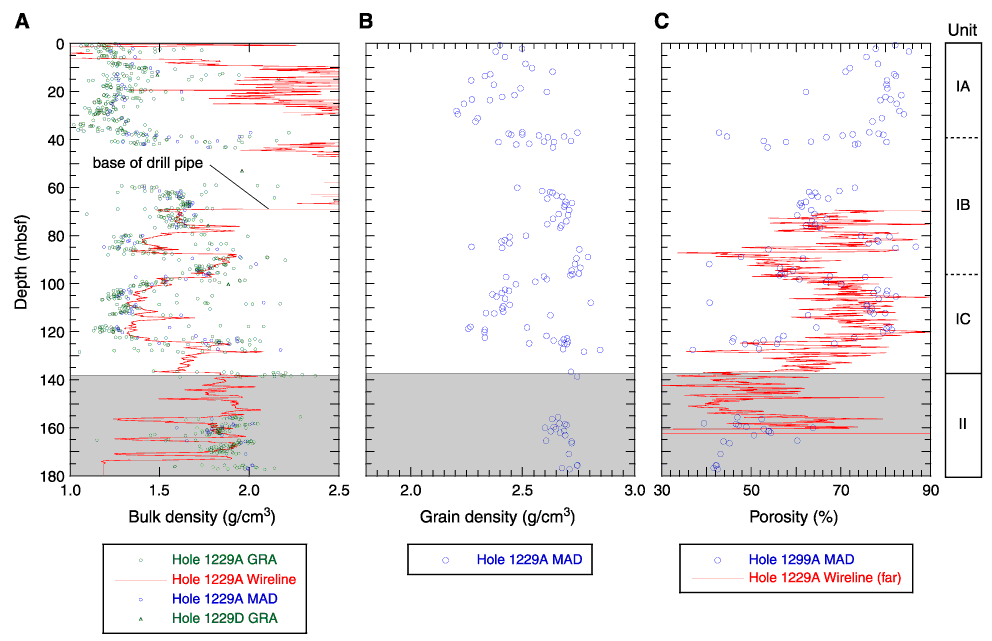
Figure F15. A. Gamma ray attenuation (GRA) density and discrete moisture and density (MAD) data from Hole 1229A compared with the wireline density log from the same hole. B. Grain density from Hole 1229A. C. Porosity calculated from MAD data compared with the wireline porosity log from the same hole.