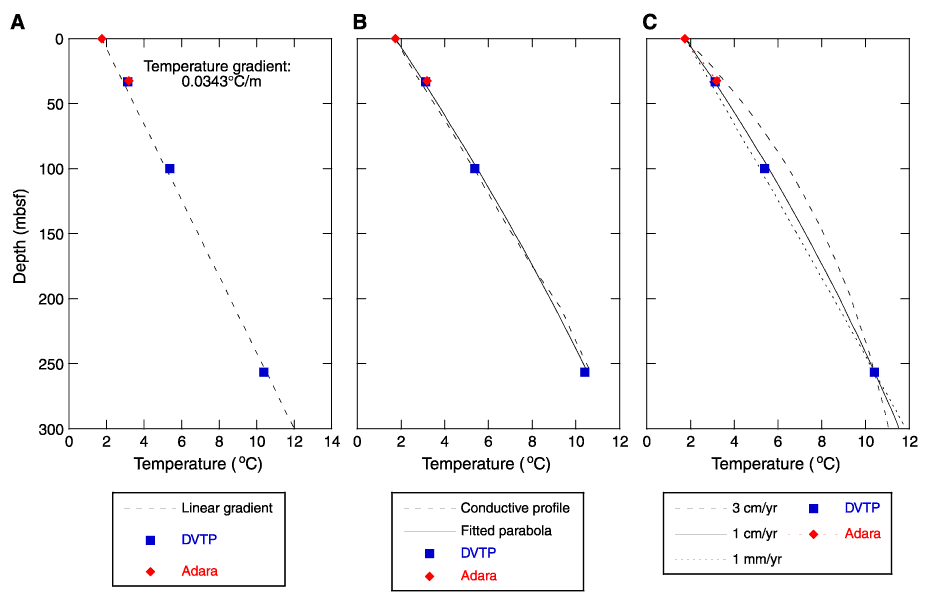
Figure F27. Temperatures measured in Holes 1230A and 1230B plotted vs. depth together with several model profiles. A. Best-fit linear profile. B. Steady-state conductive profile calculated using measured thermal conductivities from Hole 1230A and uniform heat flow. A parabolic least-squares fit is shown for comparison. C. Steady-state fluid flow with fixed temperature at depth and the flow velocities shown.