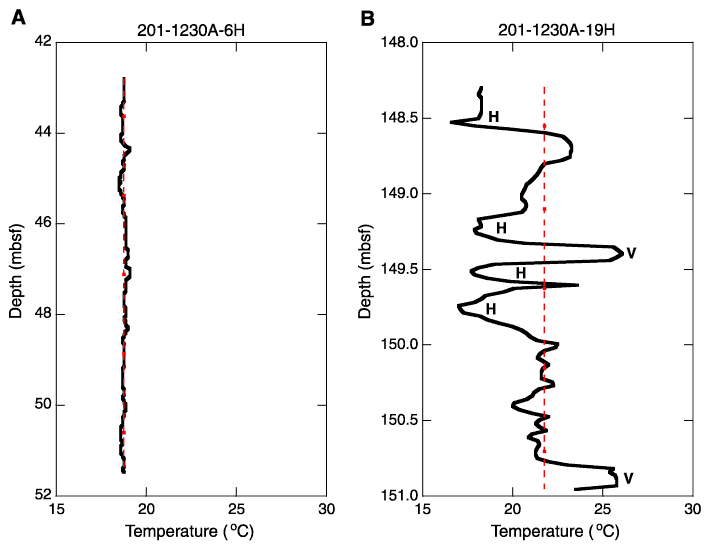
Figure F32. Comparison of temperatures recorded by the IR camera in (A) Core 201-1230A-6H without indications for gas hydrate and (B) Core 201-1230A-19H with intervals of gas hydrate (Table T14). Black solid line = measured temperature, red dotted line = average temperature. Note that the average temperature of Core 201-1230A-6H is lower than that of Core 201-1230A-19H. This is because the latter core comes from greater sediment depth and contains gas voids, which result in positive temperature excursions. V = void, H = interval inferred to contain hydrate.


![]()