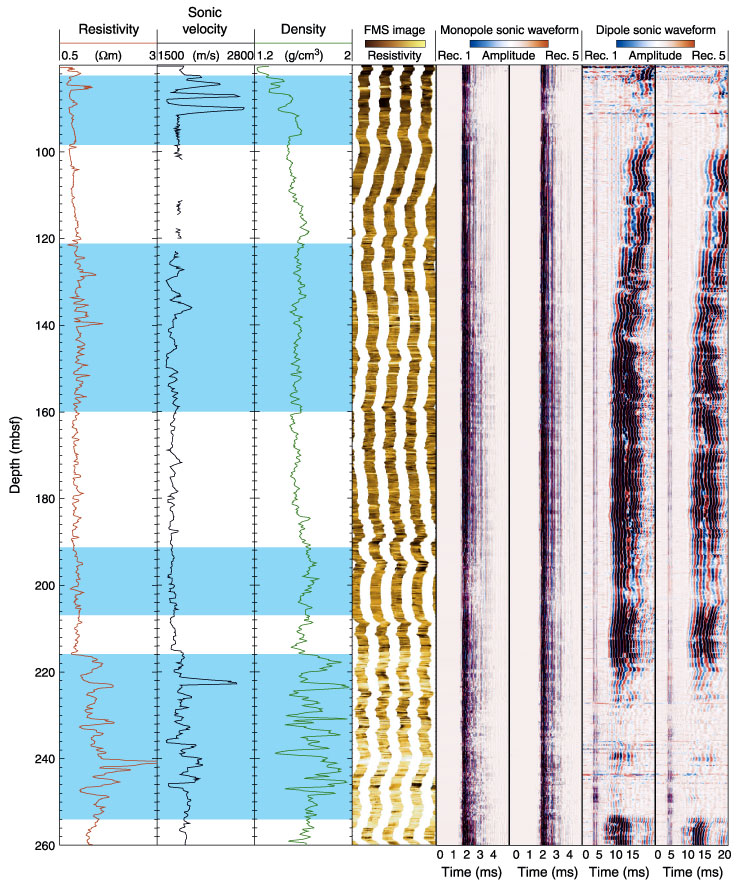
Figure F36. Identification of intervals where logging data show that gas hydrate may be present. Resistivity and velocity increase with increasing hydrate concentration, whereas waveform amplitude decreases. The density log helps to identify resistivity spikes that could be created by factors other than gas hydrate within the hydrate zone.