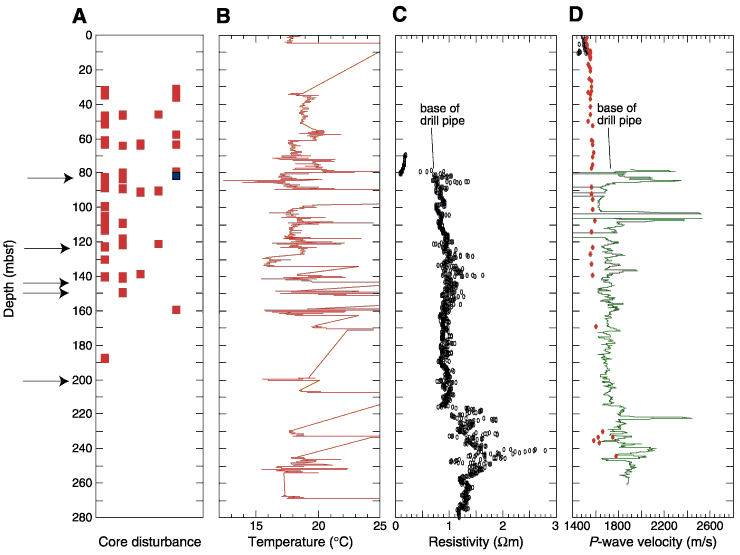
Figure F37. Stratigraphic comparison of depths with evidence for gas hydrate (marked with the arrows), core disruption, core liner temperature, and wireline logs for Hole 1230A. A. Core disturbance areas. From left to right, the black squares indicate a relative increase in core disturbance. B. Core temperature profile measured on the catwalk, based on IR thermal imaging of the core liners. C. Wireline resistivity. D. Wireline sonic velocity.


![]()