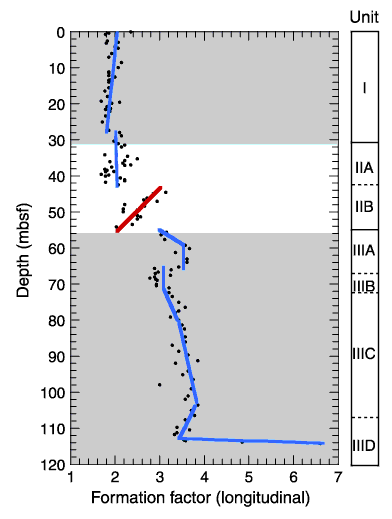
Figure F16. Formation factor profile for Hole 1231B. Trends (blue line) illustrate that porosity change is the dominant control on downhole electrical conductivity variation. The trend in Subunit IIB (red line) exhibits a counterintuitive formation factor-porosity relationship, probably explained by changing pore structure resulting from increasing clay and amorphous oxide content. The abrupt increase at ~114 mbsf mainly represents a diagenetic alteration by closing interpore pathways.


![]()