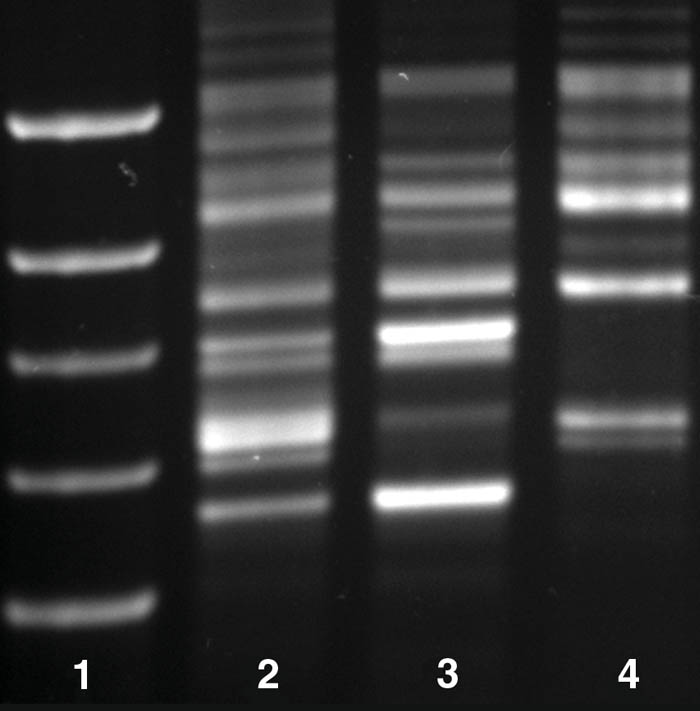
Figure F2. Fingerprint of RISA on DNA extracted from mixed populations from 0.67 mbsf and amplified with bacterial primers. Lane 1 is a molecular weight ladder. Lane 2 is the bacterial population fingerprint on day 3 of enrichment. Lane 3 is from day 15 of the same aerobic enrichment. Lane 4 is the population after numerous transfers and month-long anaerobic incubation. The progression of enrichment can be seen in the changing band patterns in lanes 2–4. Similar bands indicate that the organism is present at both times. Differing bands show the changes in population members. Band intensity can be used as a guide to the relative abundance of different organisms.