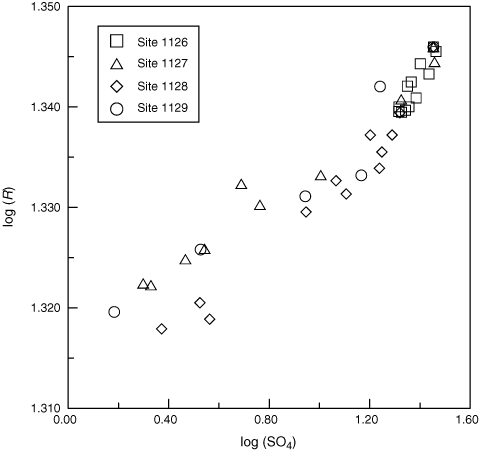
Figure F3. Rayleigh plots for pore water at Leg 201 sites (except Sites 1225 and 1231). Isotope ratios (R) were calculated using the measured isotope data based on the isotope ratio for the V-CDT standard (Ding et al., 1999). Based on chloride concentrations, all sulfate concentrations are normalized to the respective shallowest pore water sample of a given profile. Linear regression coefficients (r2) are 0.83, 0.97, 0.94, and 0.90 for Sites 1226, 1227, 1228, and 1229, respectively.


![]()