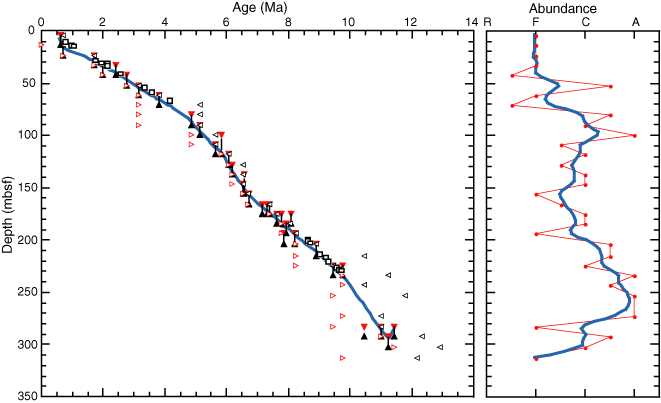
Figure F6. Age-depth plot based on diatom biostratigraphy in Hole 1225A. Solid black and red triangles show bottom and top of each diatom event. Open black and red triangles show oldest and youngest ages of each samples. Open squares show paleomagnetic stratigraphy points. A = abundant, C = common, F = few, and R= rare.


![]()