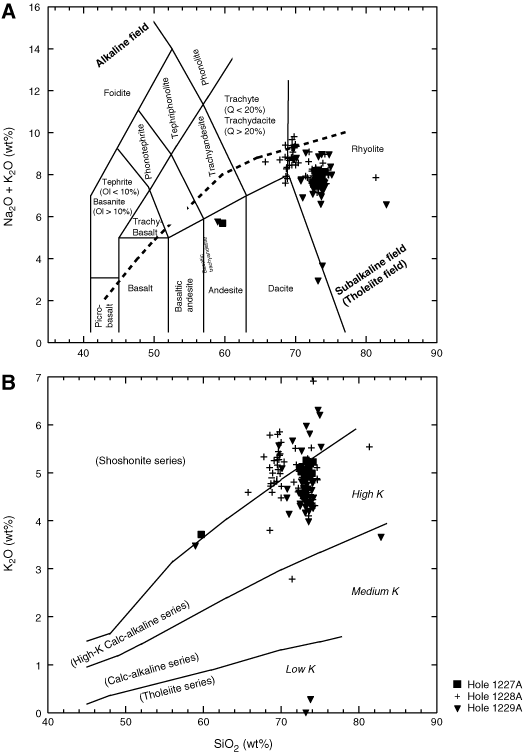
Figure F6. (A) Total alkalis (TAS) vs. silica and (B) potassium vs. silica covariation diagrams for Leg 201 glass analysis. The TAS plot displays the Irvine and Baranger (1971) alkaline/subalkaline (tholeiitic) division line (dashed line). TAS diagram values and nomenclature are from Le Maitre et al. (1989) in Rollinson (1993). B is the subdivision of the subalkaline field (divisions are from the compilation of Rickwood [1989] in Rollinson [1993]). Nomenclature in parentheses is that of Rickwood (1989) and the nomenclature not in parentheses is that of Le Maitre et al. (1989).