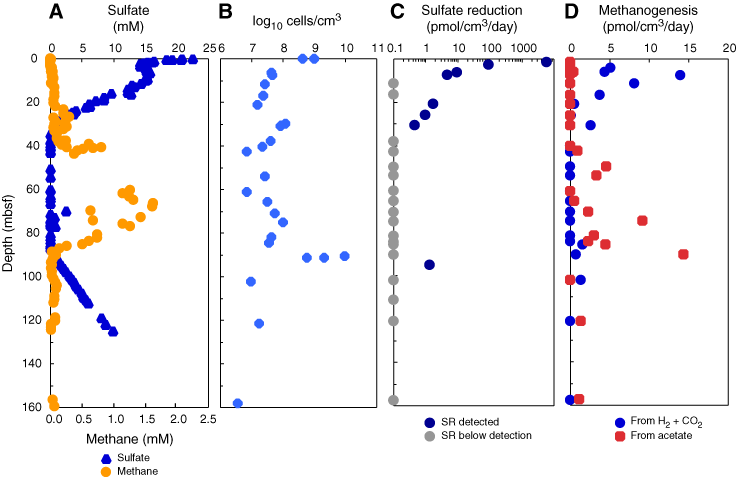
Figure F5. Site 1229 on the Peru margin. A. Sulfate and methane distribution in pore water showing two sulfate–methane transitions. B. Distribution of total microbial cell numbers. C. Rates of sulfate reduction (SR). D. Rates of methanogenesis from H2 and CO2 or from acetate (data from D'Hondt, Jørgensen, Miller et al., 2003; Parkes et al., 2005).


![]()