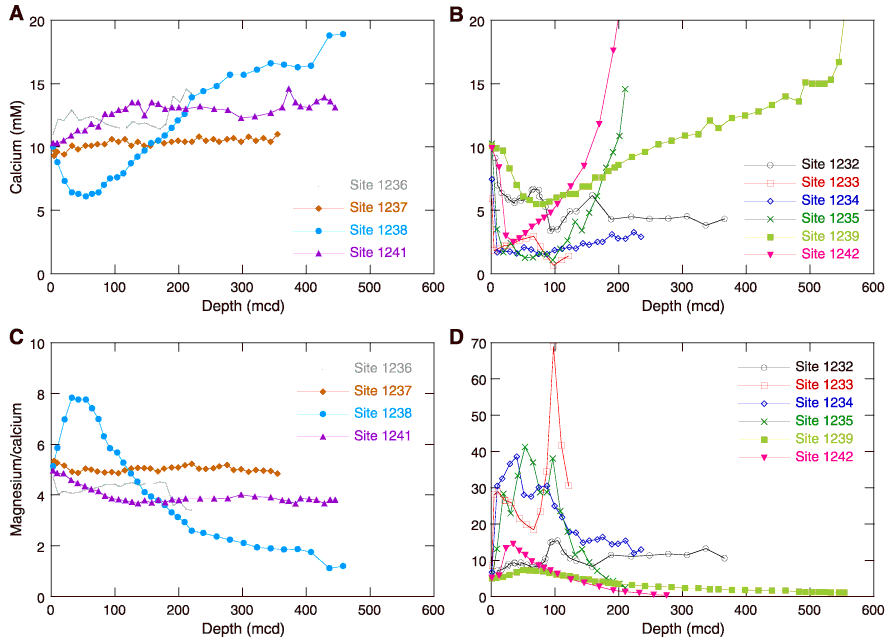
Figure F30. Interstitial calcium and magnesium/calcium profiles vs. depth. A, C. Calcium and magnesium/calcium profiles for sites with limited to moderate sulfate reduction. B, D. Calcium and magnesium/calcium profiles for sites with complete sulfate reduction. Note that the vertical scale changes from C to D.