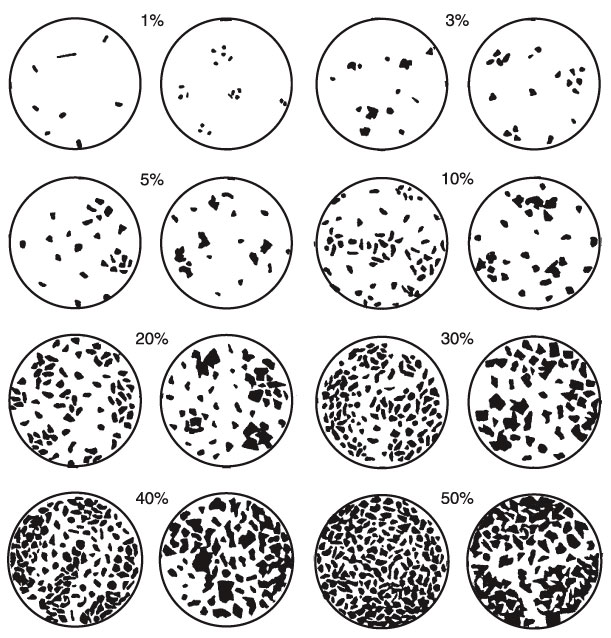
Figure F7.
Comparison chart for volume percentage estimation (after Terry and Chilingar, 1955).