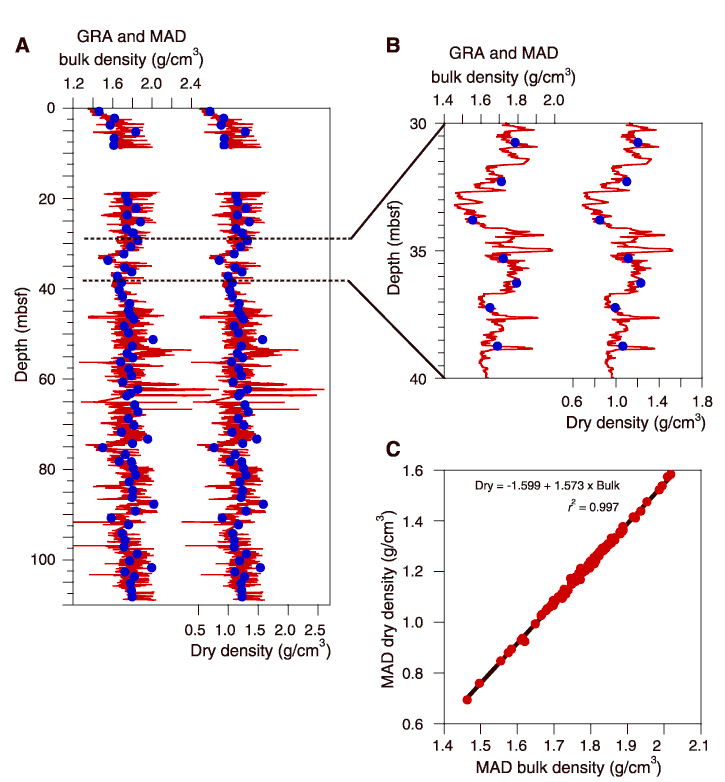
Figure F12. A, B. Comparison of gamma ray attenuation (GRA) (red lines) and moisture and density (MAD) bulk density data (blue circles). C. Dry density was calculated from GRA density by applying the relationship between MAD bulk density and MAD dry density measurements.


![]()