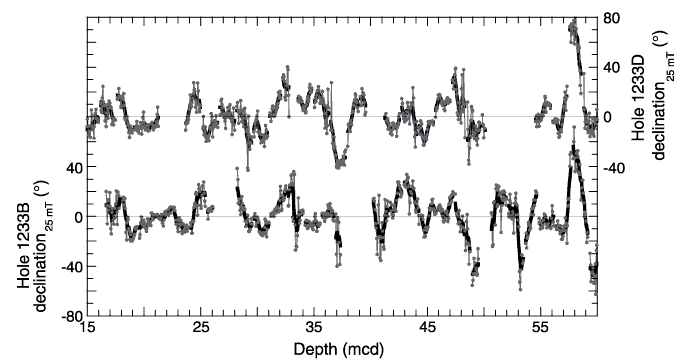
Figure F19. Comparison of declinations (25 mT) from Holes 1233B and 1233D within a 50-m interval. Notice the strong similarity in directional secular variation that can be correlated between these two holes. The solid line represents a seven-point running mean of the individual data points (solid circles).


![]()